Test Metrics
- Samir Shah (Deactivated)
- Edward Stolyar (Deactivated)
- Helen Kosova (Deactivated)
|
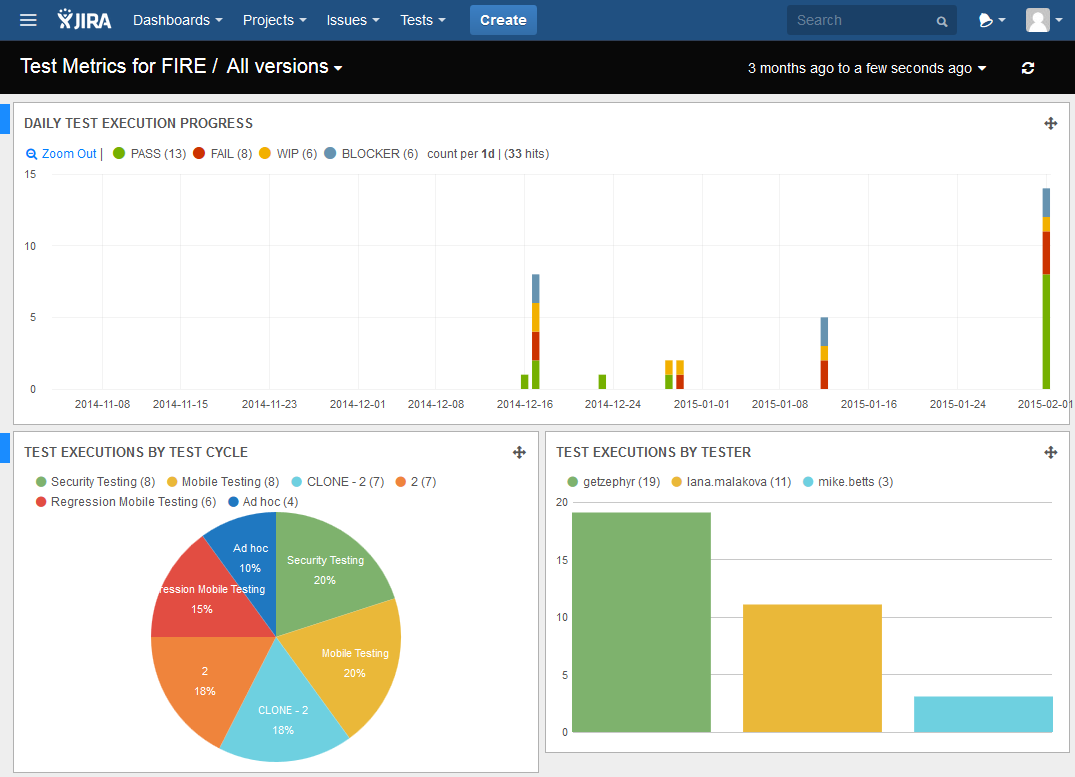
Zephyr for Jira automatically tracks several test metrics for every project:
- Daily Test Execution Progress, by status
- Test Executions by Test Cycle
- Test Executions by Tester
- Number of executions per day
- And a List of executions with their details
To access the Test Metrics dashboard:
- Open your Jira project.
- Select Zephyr in the project sidebar.
- Select Test Metrics in the sidebar.
Options
The data displayed in the dashboard can be across an entire project (i.e. including all Versions) or can be specific to a particular Version.
You can also change the data range for which the data is displayed. In the above example, the range is set to "3 months to a few seconds ago". Click on that to pick another option.
A tiny refresh icon allows the data to be refreshed on demand. Auto-refresh options also exist. Pick one of the various available refresh rates by clicking on the range and selecting the "Auto-Refresh" option.
Each panel of this dashboard can be moved around to a different location, during a single session.
Changes made to this dashboard are only remembered for the current session. All defaults are restored when the metrics page is refreshed.
Customizable Test Metrics (Gadgets) and Dashboards
5 different types of metrics can be customized and added to standard Jira Dashboards. Click here to learn how.