Gadgets
Dashboard Gadgets
Zephyr gadgets are extremely configurable allowing users the functionality to include various projects and releases to track multiple statistics regarding the testing activities included in Zephyr.
- When configuring dashboard gadgets, users can take full advantage of the ability to set a default value for the refresh rate in the customization page of administration.
- Zephyr has also included the option to easily maneuver gadgets within a dashboard. Zephyr provides users with the ability to utilize the simplicity of a drag-and-drop feature to let users customize the look and design of the dashboard by maneuvering the gadget position.
The following sections will explain the dashboard gadgets in Zephyr:
Project Status
This gadgets displays the status of a project providing key indicators for viewing:
- Release Count
- Releases In-Progress Count
- Total Test Case Count
- Total Test Case Execution Count
- Total Assigned Members on the Project Count
Requirements Status
A visual representation of the mapped and unmapped requirements in specific release of a project.
Testcase Status
A gadget that displays the general status of test cases within a release.
The measures for the test cases are:
- Total Testcases
- Total Testcases by Tags
- Total Testcases Created by Users
Execution Progress
A gadget used to display the status of the test case execution progress within a release.
- This gadget measures the test executions completed across all test cycles and the completed test cases for each test cycle.
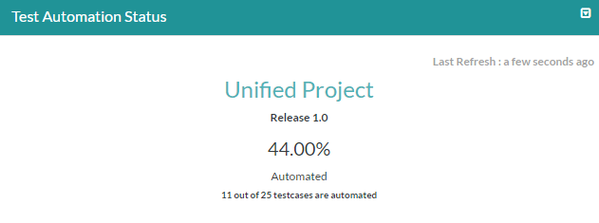
Test Automation Status
A gadget that visually shows the automated status of test cases in a particular release.
Test Automation Distribution
A gadget to assist in displaying the percentage of tests that are automated with respect to the testing phases or by specific tags in the release.
Test Execution By Cycle
A gadget that displays the overview of the test executions by tests test cycles. The gadget displays the total test case count for test cases executed and their test case status.
Execution Backlog
A visual representation that displays the total unexecuted test cases within a release.
The Backlog can be filtered by the following:
- Users
- Priority
- Tag
- Phase
- Custom Field
Open Defects
A gadget used to display the total open defects count within a particular release.
The gadget can be filtered by either the priority or severity.
Overall Defects
A gadget that assists in displaying the overall defect status within a particular release.
The defects are tracked by the following:
- Defects Created
- Defects Open
- Defects In-Progress
- Defects Closed
Traceability
A visual representation to display the requirements traceability matrix by displaying the following:
- Mapped Test Case Count
- Pass/Fail Test Case Execution Count
- Defects Created Count
Daily Pulse
This gadget shows a running view on all testing activity and tracks the progress of tests created, tests executed, and defects found.
The data is displayed in a line chart format and allows the user the option to turn off any of the lines for tests created, tests executed, defects found.
Suppose we have a selected date range for 7 days. If we have data for 5 days and the data within the last 2 days is not there, then the last day trend data will reflect the count. The count and chart will show data for the 6th day because we have the trend data.
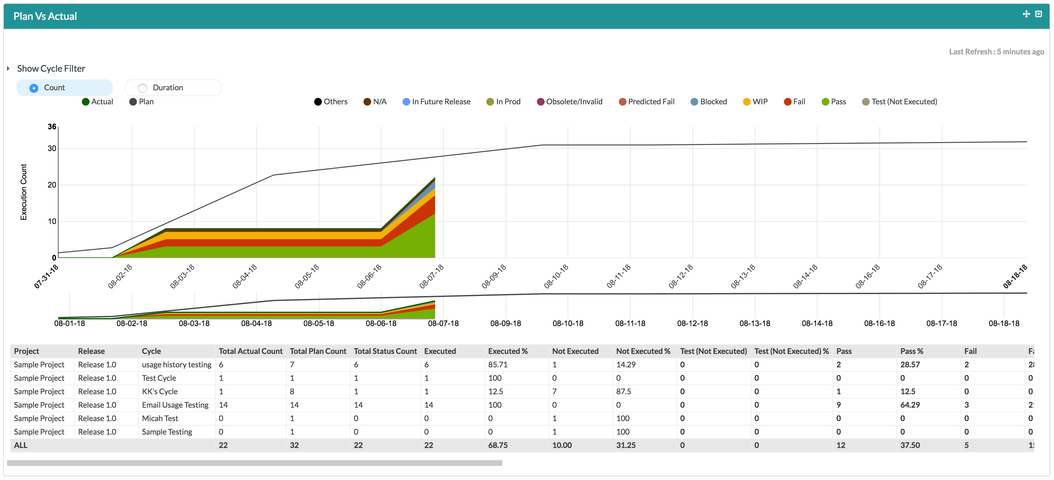
Plan vs. Executed
This gadget is essentially an existing report that has been made configurable to provide users which shows the current execution plan, the actual execution progress, and what it takes to catch up with the test plan.
- The gadget will display statistics and information regarding your statuses of your executed test cases across one or multiple testing cycles in Zephyr.
- The gadget supports up to a total of 10 different statuses (beyond 10 statuses is not supported).
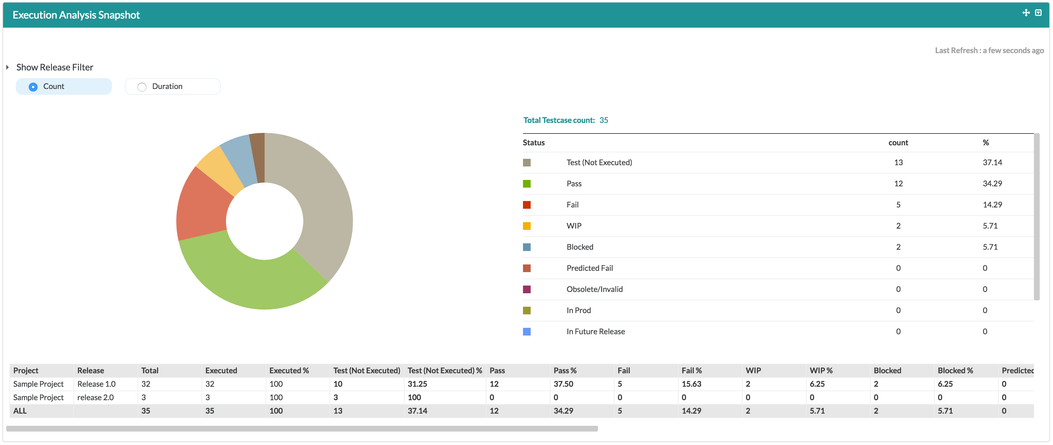
Execution Analysis Snapshot
This gadget essentially creates a pie chart that displays the total number of test case executions broken down by the test case execution statuses.
- The gadget will also display a table view that allows users to preview further information where your users are able to configure and preview the statistics for the testing statuses for your project and releases.
- Configuring the Execution Analysis Snapshot allows users the ability to include as many releases from a project, the different statuses, and the refresh rate.
Test Case Count
This gadget essentially creates a table with the following that displays the test count per folder for each release and project.
- Users are able to track the total number of test cases for each individual folder as well as the total number of test cases within the specific release and project.


