Reports
- Kevin Pham (Deactivated)
- Marc Ray (Deactivated)
Overview and Reporting Options
Zephyr offers multiple built-in reporting options that allow your users to track the progress and trends across all your testing activities. Please review the following sections for each individual gadget:
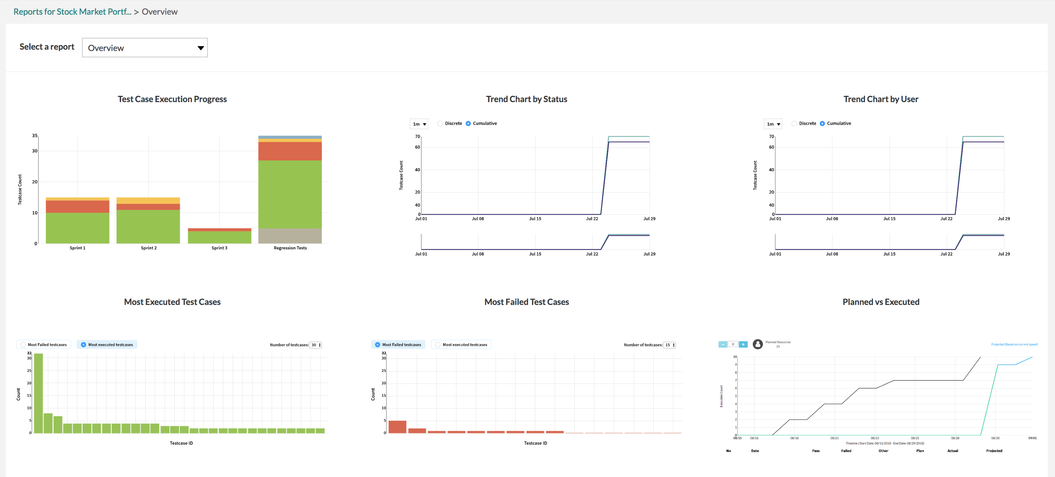
Test Case Execution Progress
The user is able to view the visual representation of the test case executions and the progress of those executions.
- The chart displays the execution progress across all the cycles in a particular release.
- There is additional information below the chart that breaks down the execution progress per cycle.
- The chart displays the status of all the executions for all cycles in the particular release.
- Users have the ability to filter the chart by the status of the executions. Use the right side of the chart to filter and the following default status filters are:
- Not Executed
- Pass
- Fail
- WIP
- Users have the ability to filter the chart by the status of the executions. Use the right side of the chart to filter and the following default status filters are:
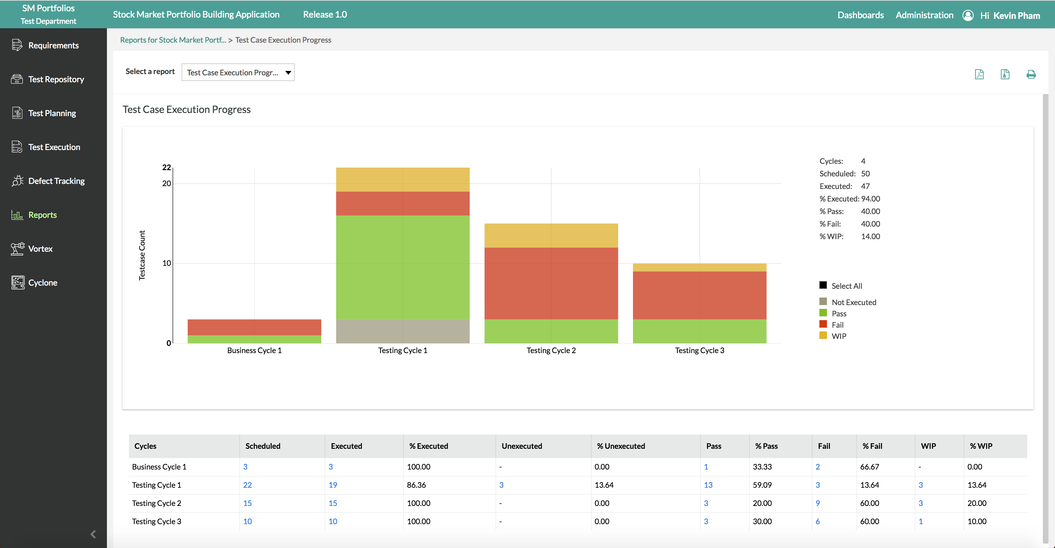
Users are able to interact with both the chart and table to view further information to be able to spot trends or analyze the performance for the particular release.

Trend Chart by Status
The user is able to view the visual representation of the test case executions sorted/filtered by the status of those executions.
- The chart displays test case executions by status in a particular release.
- Users have the ability to filter the chart by the status of the executions. Use the right side of the chart to filter and the following default status filters are:
- Pass
- Fail
- WIP
- Blocked
- Predicted Fail
- Users have the ability to filter the chart by the status of the executions. Use the right side of the chart to filter and the following default status filters are:
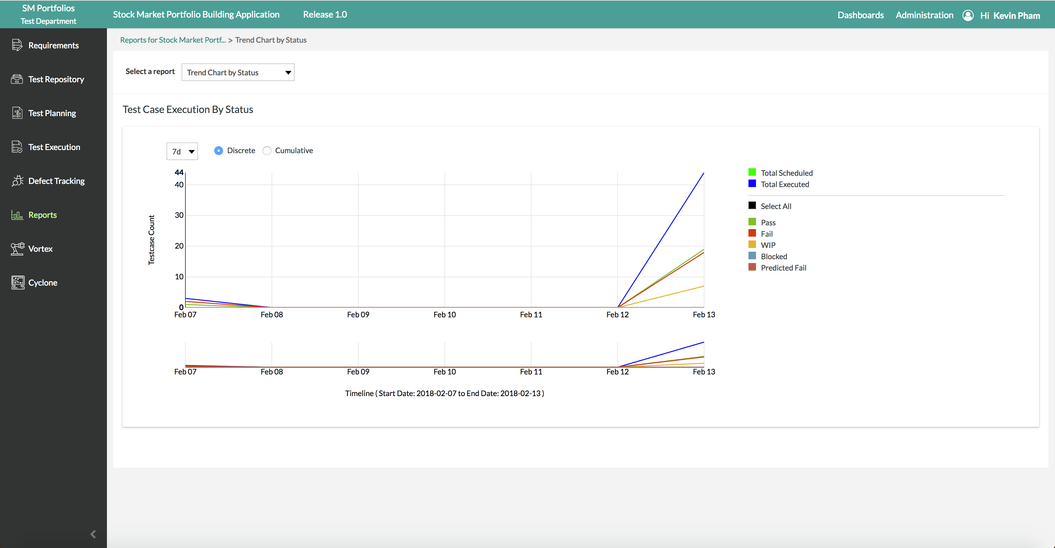
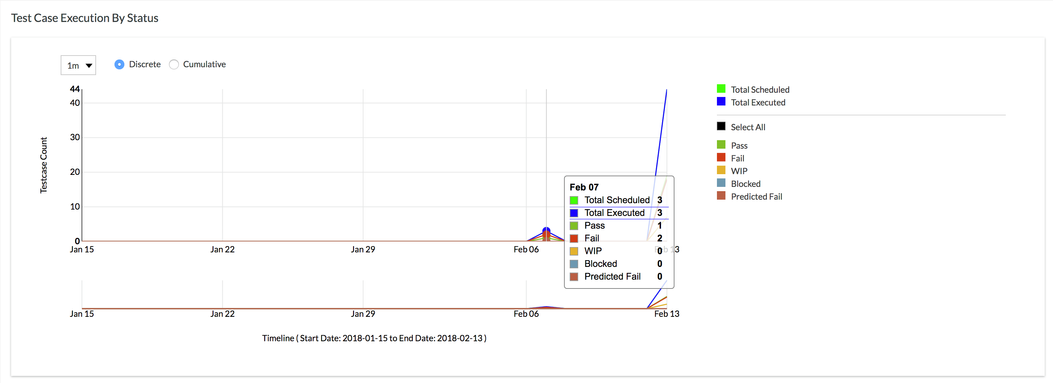
Users are also able to highlight their mouse over the lines on the graph to view further information on the test case executions.
- When a user highlights over the line, the chart displays the status count of test executions on that particular date.
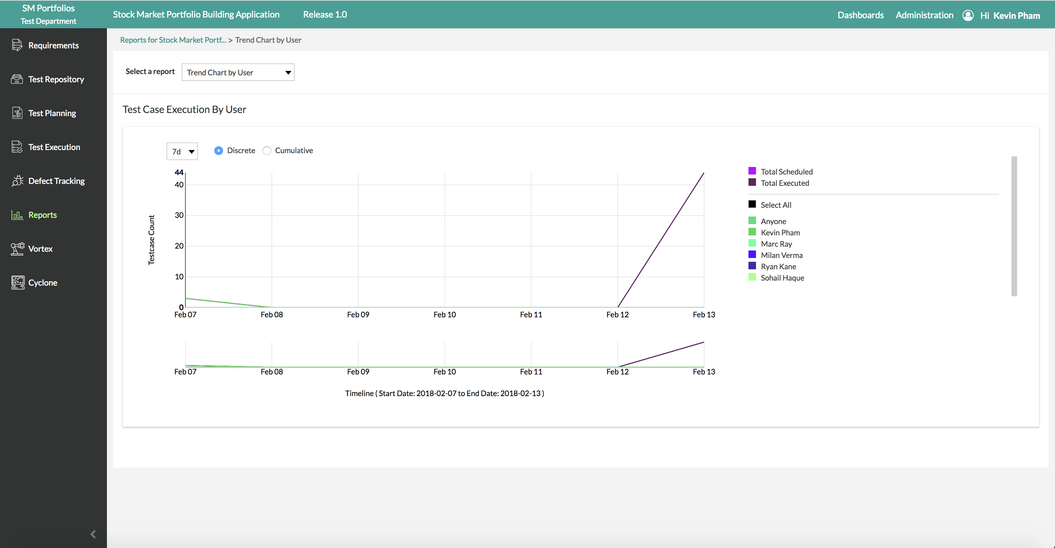
Trend Chart by User
The user is able to view the visual representation of the test case executions sorted/filtered by the users of those executions.
- The chart displays test case executions by users in a particular release.
- Users have the ability to filter the chart by the users of the executions. Use the right side of the chart to filter the users. The users will vary on the active users assigned to the project.
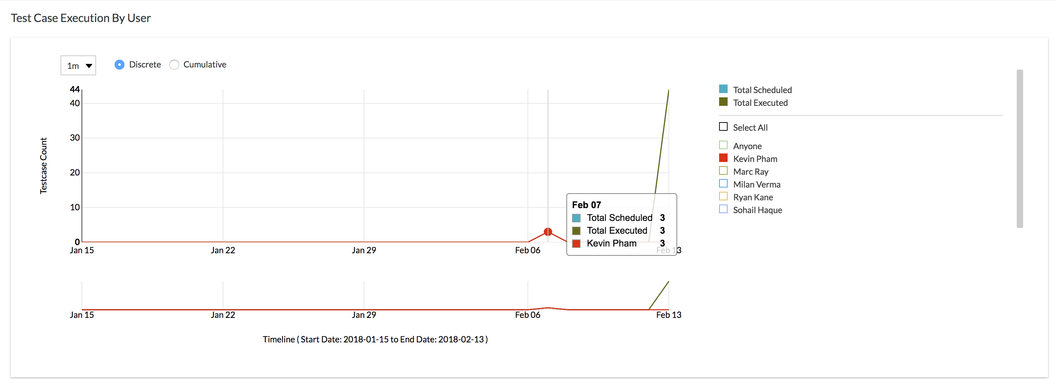
Users are also able to highlight their mouse over the lines on the graph to view further information on the test case executions.
- When a user highlights over the line, the chart displays the count of test executions sorted by users on that particular date.
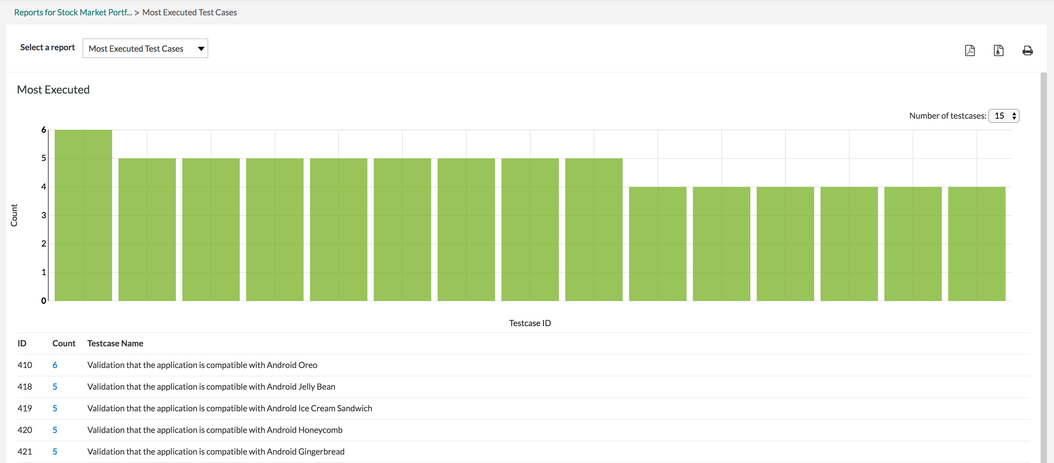
Most Executed Test Cases
The user is able to view the visual representation of the test case executions that are executed the most.
- Displays the test cases that have been executed the most based on their execution history across testing cycles in the release.
For example: Within each test cycle, there may be some test cases that users tend to execute multiple times (repeating test cases across cycles) or test cases that take a significant amount of time to execute (lengthy execution times).
- Users can utilize this information to further improve future releases by determining to automate these test cases.
- Users are able to analyze and improvise their current process to be able to meet their plans.
Most Failed Test Cases
The user is able to view the visual representation of the test case executions that are failed the most.
- Displays the test cases that have failed the most based on their execution history across testing cycles in the release.
For example: Within each test cycle, there may be some test cases that users tend to fail multiple times (repeating test cases that have failed across cycles).
- Users can utilize this information to further improve future releases by determining to resolve these failed test cases.
- Users are able to analyze and improvise their current process to be able to meet their plans.

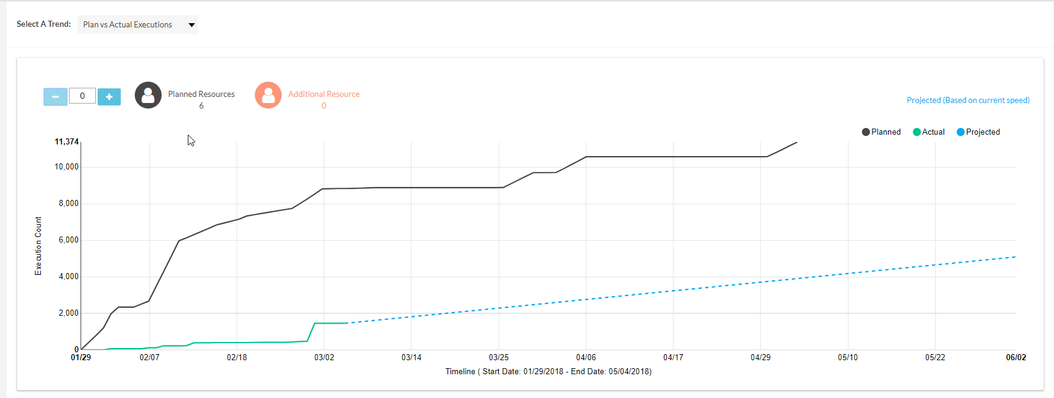
Planned vs. Actual
The Plan vs. Actual Execution is a widget that shows the current execution plan, the actual execution progress, and what it takes to catch up with the test plan.
Planned: The plan will display the actual count of test cases assigned to all the users within that release.
Actual: The actual count will show the number of test cases executed until the current day (today's date).
Projected: The projected will show how many test cases can be executed, using the same planned resources. This is displayed at the end of the timeline.
Predicted: The prediction will display and predict the number of executions per person that can be done per day based on the previous execution history.
- Based on the predicted capacity of 104 executions per person a day.
Additional Notes
If the cycle is completed, then the prediction will not show.
Per person per day predictions are calculated by a cloud engine based on their previous execution history.
Predictions can be viewed when test cycles and test cases are assigned to users in the current release.
Exporting to Reports
As of now, only the Testcase Execution Progress, Most Executed Test Cases, Most Failed Test Cases, and Planned vs Actual Execution metric have the option to export via PDF, ZIP, or Printable format.
- To export to a PDF, simply click on the
 icon at the top right of the interface.
 - To export to a ZIP, simply click on the
 icon at the top right of the interface.
 - To export to a Printable format, simply click on the
 icon at the top right of the interface.