Cyclone Widgets
Overview
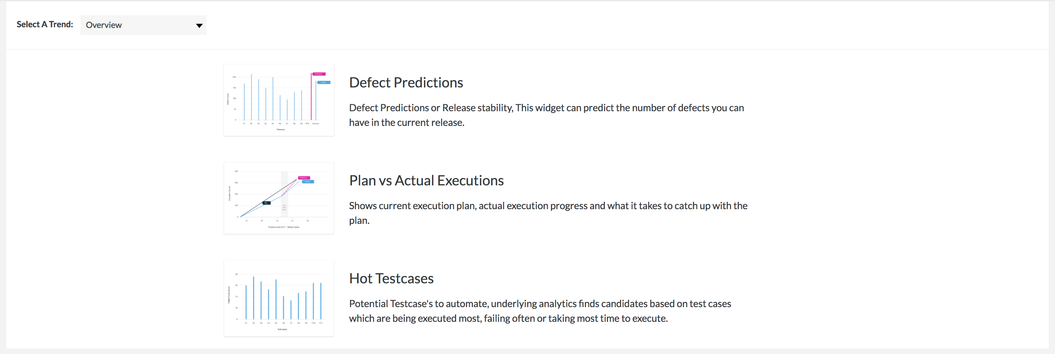
Cyclone consists of 3 different widgets to help provide users with predictive analytics of the current release to be able to improve future releases by utilizing the trends from the current or previous release.
Defect Prediction
The Defect Prediction or Release Stability is a widget used to predict the number of defects that you can have within the current release.
- Each project/release must contain executed test cases.
- The widget will predict the number of defects based on the history of the previous projects and their releases.
The release end date should be mandatory (set as a future date). If there is no end date, the user will get a prompt that states the following: "Please set the end date for this release before proceeding".
If the release is already completed, the user will get a prompt that states the following: "Please select an ongoing or future release to view the prediction".
Plan vs. Actual Execution
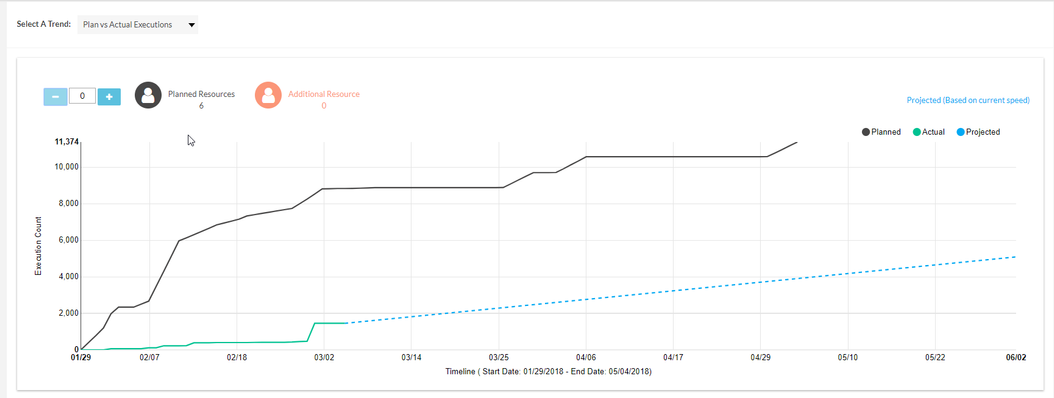
The Plan vs. Actual Execution is a widget that shows the current execution plan, the actual execution progress, and what it takes to catch up with the test plan.
Planned: The plan will display the actual count of test cases assigned to all the users within that release.
Actual: The actual count will show the number of test cases executed until the current day (today's date).
Projected: The projected will show how many test cases can be executed, using the same planned resources. This is displayed at the end of the timeline.
Predicted: The prediction will display and predict the number of executions per person that can be done per day based on the previous execution history.
- Based on the predicted capacity of 104 executions per person a day.
Additional Notes
If the cycle is completed, then the prediction will not show.
Per person per day predictions are calculated by a cloud engine based on their previous execution history.
Predictions can be viewed when test cycles and test cases are assigned to users in the current release.
Hot Testcases
Hot Testcases is a widget that shows the potential test cases to automate. This is useful widget that allows users to discover which test cases can and should be automated. Users are able to analyze and improvise their current process to be able to meet their plans.
There are two ways to view the hot test cases.
- Most Failed Testcases: Displays the test cases that have failed the most based on their execution history across testing cycles in the release.
- Most Executed Testcases: Displays the test cases that have been executed the most based on their execution history across testing cycles in the release.
For example: Within each test cycle, there may be some test cases that users tend to execute multiple times (repeating test cases across cycles) or test cases that take a significant amount of time to execute (lengthy execution times).
- Users can utilize this information to further improve future releases by determining to automate these test cases.
Additional Notes
Users can click on the values in the "Count" column to navigate to the executions for that particular test case.
Hot Testcases will only display as low as 15 and up to 200 of the most failed or most executed test cases.


