...
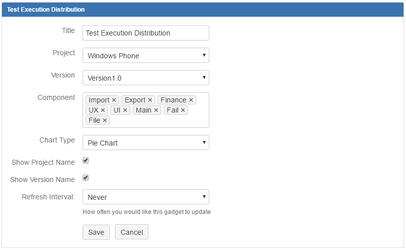
This gadget shows the test execution distribution arranged by project and version. This can be further filtered to include only a set of components in the executions.
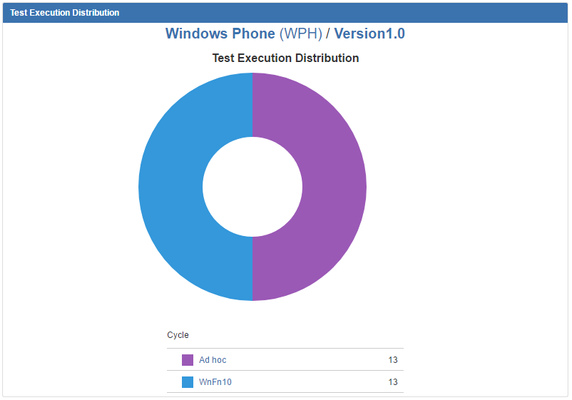

The gadget can be customized via the Edit button on the top-right. Dashboard owners can pick the project, version, and components with execution numbers to be displayed. This gadget can be displayed in either pie or tabular formats. Adding a component to the display will show a breakdown of the cycles with executions in the project and version that have those components as part of them. Other executions will not appear.

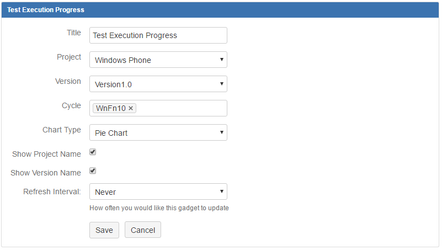
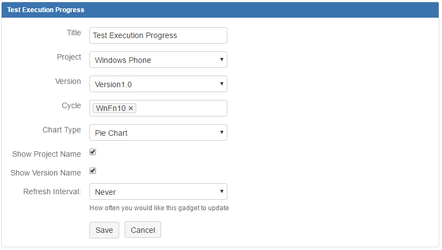
Test Execution Progress
| Anchor | ||||
|---|---|---|---|---|
|
This gadget shows the test execution status breakdown for a single or multiple cycle. The amounts will be added together if multiple cycles are selected.
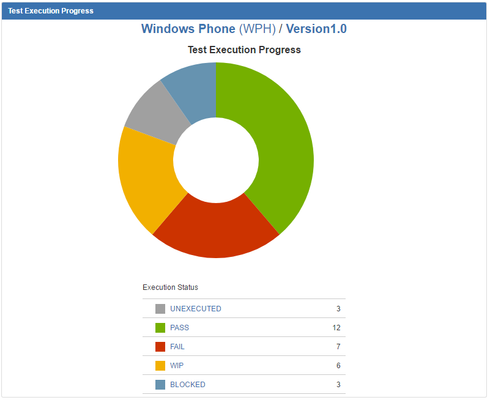

The gadget can be customized via the Edit button on the top-right. Dashboard owners can pick the project, version, and cycle(s) be counted and displayed. This gadget can be displayed in either pie or tabular formats.