Introduction
Project-specific testing reports can be viewed via a JIRA project's Reports section. The following testing reports are made available with Zephyr for JIRA:
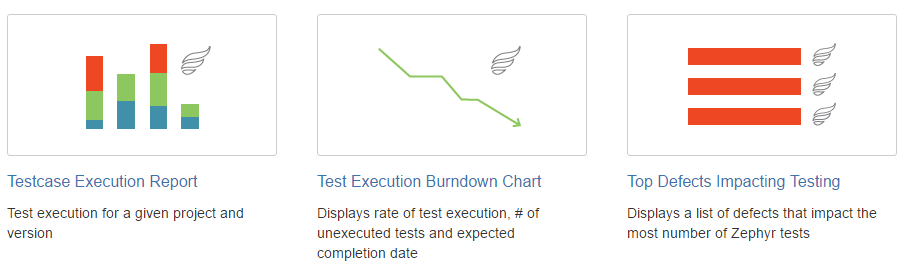
- Testcase Execution Report
- Test Execution Burndown Chart
- Top Defects Impacting Testing
Open the Reports section and scroll to the section called Other. Select one of the available report templates and you will be able to custom the data observed on the report with the options presented.
Testcase Execution Report
| Anchor | ||||
|---|---|---|---|---|
|
The Testcase Execution Report will display execution information for a selected project and version.

The report can be customized before creation or after creation by selecting the Configure option in the top right corner. The project and version can be changed. Testcase Execution report data can be grouped either by cycle, component, user, and sprint - cycle. There is an option to limit the number of cycles shown in this report - 0 being default and unlimited, and an option to show others.

Test Execution Burndown Chart
The Test Execution Burndown Chart will display cycle execution information in terms of a timeline for the selected project and version.

The report can be customized before creation or after creation by selecting the Configure option in the top right corner. The projec, version, sprint, and cycle settings can be changed. You can select to include all cycle information from the version or just a single cycle.

Top Defects Impacting Testing
The Top Defects Impacting Testing report will show a list of the defects which are stopping the most amount of executions from passing. This is purely numerical and does not take priority into account.

The report can be customized before creation or after creation by selecting the Configure option in the top right corner. The project and version can be changed. The Top Defects Impacting Testing report data can be grouped either by bug status and listed by how many you want to view in the report from 5 to 20 in increments of 5.
